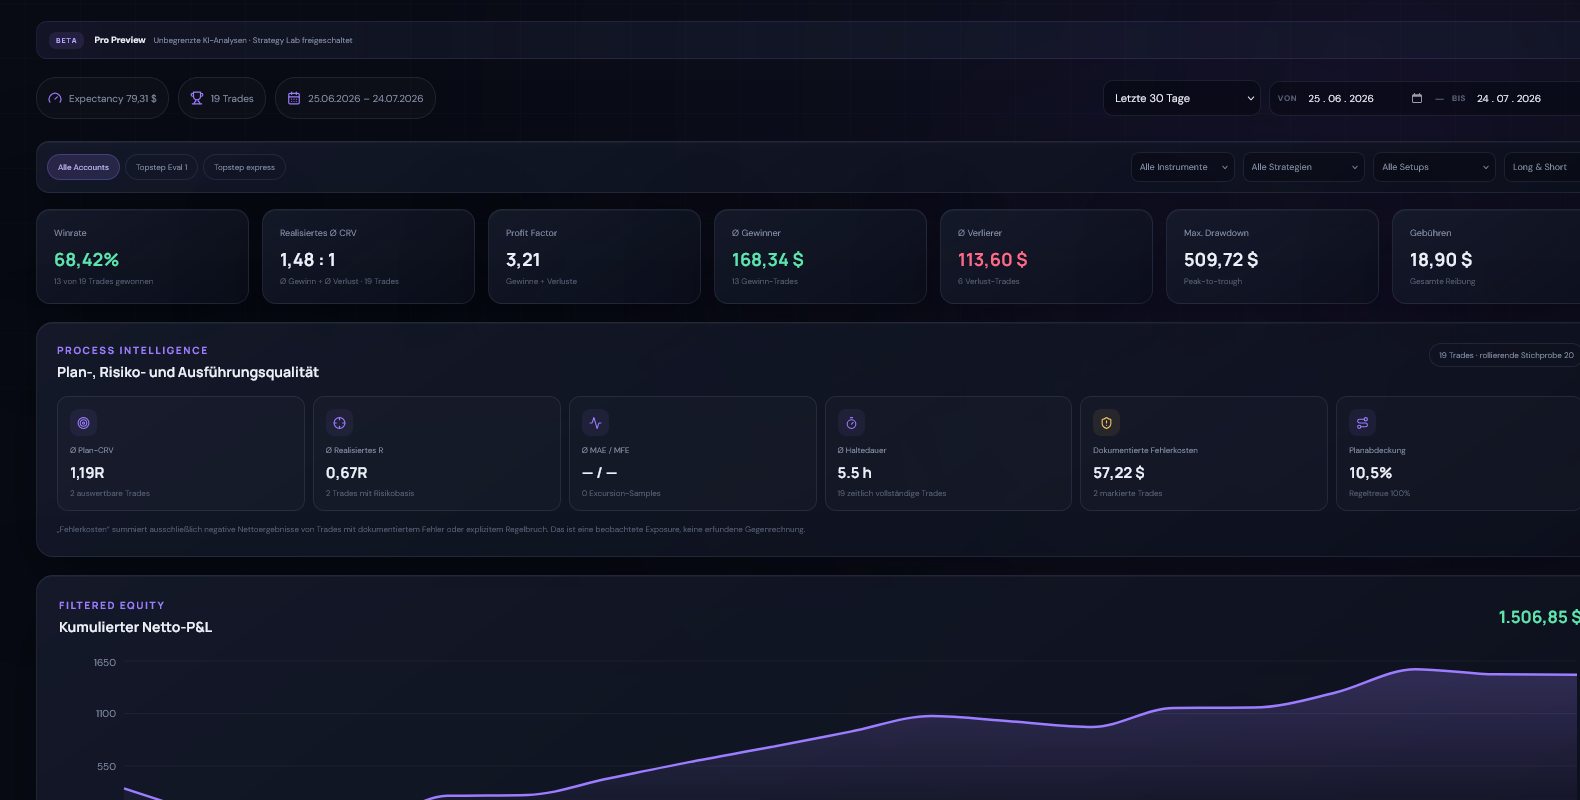
Win rate answers one question only
Win rate measures the share of closed trades that finished positive. It does not show how large winners and losers were, how much friction was paid or whether a few outliers carry the full result. A strategy can be right often and still lose money.
The reverse is possible too. A lower-win-rate strategy can remain profitable when its average winner is sufficiently larger than its average loser. Accuracy should therefore never be evaluated without the outcome distribution and sample size.
The mistakeA 70% win rate is not automatically better than 45%. The payoff attached to each winner and loser decides the distribution.
Expectancy combines hit rate and outcome size
A simple expectancy in R is: win probability × average winner in R minus loss probability × average loser in R. R represents the amount defined as risk before the trade. This is not a forecast for the next trade; it describes the sample that has already occurred.
CME Group explains the same mathematical principle: a model may have positive average expectation even when it loses more often than it wins. Conversely, one large loss can erase the comfort of a high hit rate.
| Example | Win rate | Avg winner | Avg loser | Expectancy before costs |
|---|---|---|---|---|
| Strategy A | 70% | +0.50R | −1.00R | +0.05R |
| Strategy B | 45% | +2.00R | −1.00R | +0.35R |
Illustration onlyThe table does not validate a real strategy. It demonstrates why identical-looking accuracy can carry very different economics.
Costs attack small edges first
Expectancy before costs is not expectancy after costs. Commissions, exchange and platform fees, and slippage recur more often in high-frequency approaches. A small gross edge can disappear completely after friction.
The same applies to R-multiples. If planned risk contains only the stop distance while real execution and fees are missing, the result is optimistic. A useful ledger preserves gross P&L, costs and net P&L separately.
- Keep gross and net results separate.
- Expose fees per trade and across the full period.
- Estimate slippage only from observed execution data—never invent a default.
- Compare like-for-like accounts, instruments and cost models.
A good metric can sit on a weak sample
An expectancy of +0.8R across five trades is an interesting interim result, not strong evidence. The smaller the sample and the more a few trades dominate it, the greater the uncertainty.
Instead of claiming a universal minimum trade count, analysis should disclose the number of trades, covered period and stability across sub-periods. It should also test whether an apparent edge exists only in one regime, instrument or session.
The better question is not “What is my win rate?”
Ask what distribution sits behind it. How large are winners and losers? Which trades contribute most of the result? What happens after fees? Does expectancy remain positive in a later sample?
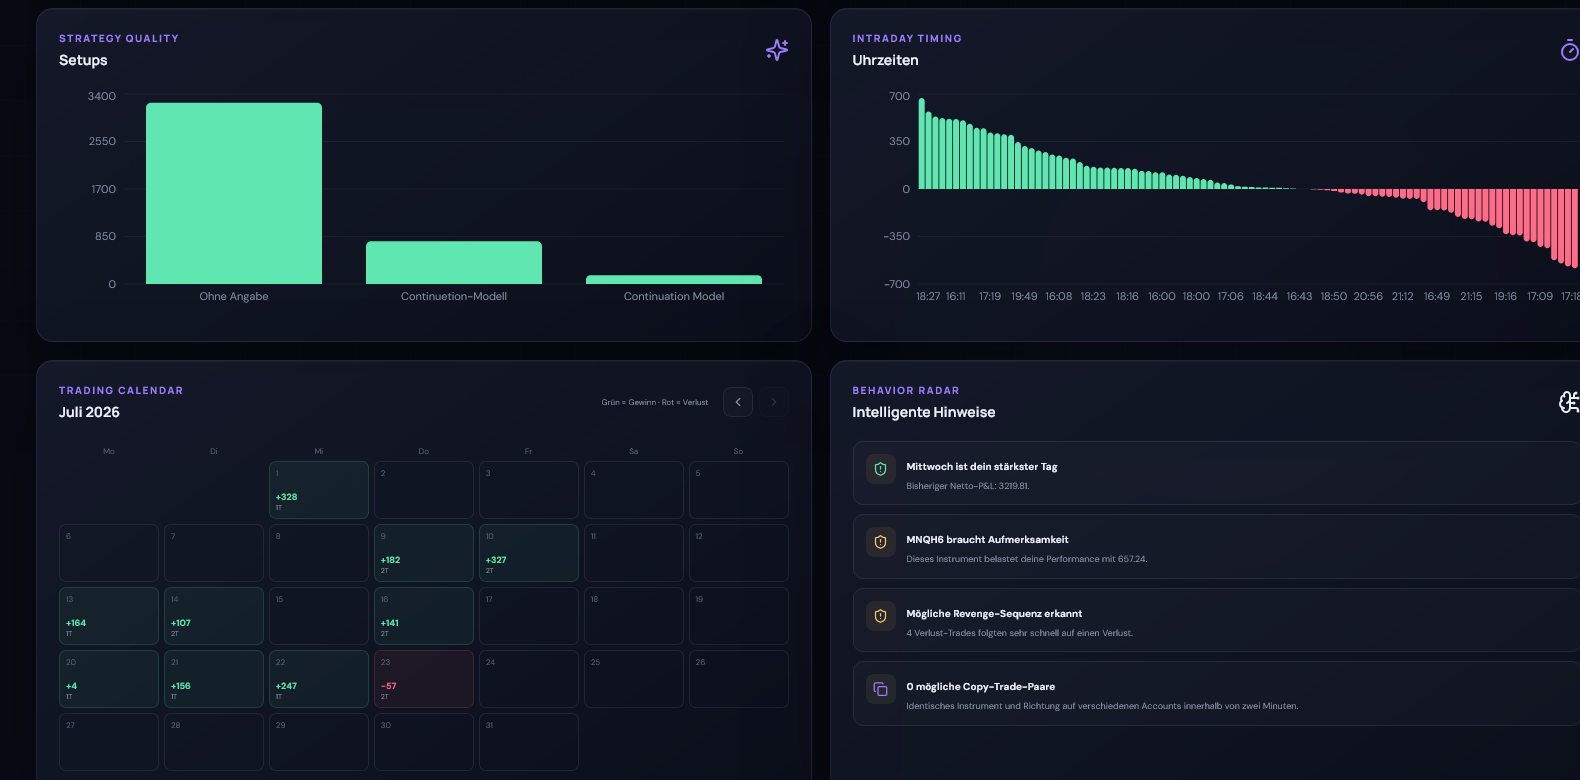
Aether Ledger places win rate beside realized R, profit factor, average winner and loser, drawdown, fees and trade count. No metric becomes truth on its own. Together they form a more honest description.
Sources and further reading
The formulas describe historical samples and are not forecasts or promises of performance. Example values are explanatory only.